
Current forest management intensity and cost associated with major forestry practices in Arkansas, USA
Current forest management intensity and cost associated with major forestry practices in Arkansas, USA
Sagar Godar Chhetri,a,* and Matthew Pelkki,a
a: Arkansas Center for Forest Business, College of Forestry, Agriculture and Natural Resources, University of Arkansas, Monticello, AR, USA
*Corresponding author: E-mail: chhetri@uamont.edu
Citation: Chhetri SG., Pelkki M. 2022. Current forest management intensity and cost associated with major forestry practices in Arkansas, USA. J.For.Bus.Res. 1(1): 51-74.
Received: 1 September 2022 / Accepted: 12 December 2022 / Published: 19 December 2022
Copyright: © 2022 by the authors
ABSTRACT
Arkansas’ forestlands are largely owned by private landowners: family, industrial or corporate forest landowners (5.1 million hectares; 67%). Family forest landowners own 4.4 million hectares of forestland (58%). The costs of forestry practices influence landowners’ decisions in forest management. However, state-specific costs for forestry activities are not readily available. The study aims to compare the forest management objectives between family and industrial or corporate forest landowners and also provide robust information about forest management intensity and the unit cost associated with those activities. We employed an online survey to 318 consulting foresters working in the state. In addition, we used Forest Inventory and Analysis dataset in ArcMap (10.8.1) to validate the survey result. Among various forestry practices, landowners requested various services from consulting foresters, including chemical site preparation, thinning, timber cruising and marking, and timber inventory. The unit cost for mechanical site preparation was the highest among several forestry practices, and these costs varied based on forest types. Various stakeholders can utilize the study findings from landowners, forest industries, and policymakers in forest investment decision-making, which can improve sustainable forest management.
Keywords: consulting foresters, family forest owners, industrial or corporate forest, forest management, cost
INTRODUCTION
Arkansas has more than 7.3 million hectares of forestland, 56% of the state’s land area. Private forest landowners own 67% of Arkansas’ forestlands. Family forests account for 58%, corporate forests account for 10%, and the remainder are other institutional owners (Arkansas Department of Agriculture 2022; USDA Forest Service 2022). Approximately 20,000 hectares of non-forest land revert to forest annually. Arkansas’ economy is the most forestry-dependent of all the southern states (Pelkki and Sherman 2020); forest industries contribute more than six billion dollars (or 5%) annually to the state’s Gross Domestic Product. Also, more than 61 thousand jobs are supported by the forestry sector (Tian and Pelkki 2021).
Landowners own forestland for multiple purposes or objectives (USDA Forest Service 2021). These objectives are influenced by ownership type. The primary ownership reasons for family forest owners (FFO) include rural area residence, land investment growth, domestic use, aesthetics, and recreation purposes. Although timber production is not reported as a primary or secondary objective of FFOs, about 50% of FFOs sell timber from their forestland (Kluender 2000). About 90% of survey respondents (or landowners) were willing to sell timber if offered the right price (Conrad et al. 2011). Financial returns from timber production and growth in real estate value were the most important objective for industrial or corporate forest landowners (IFL) (Wicker 2002). Since forestland holding objective is dissimilar among FFOs and IFLs, the forest management intensity also varies among ownership type. IFLs usually hold large tracts of forestland and apply more intensive silviculture activities to maximize financial returns. Larger land holdings provide the opportunity to implement more than one forestry activity simultaneously (Adhikari et al. 2021). Also, IFLs can enjoy an economy of scale from operations on large landholdings (Conway et al. 2003). As a result, the costs and expenditures for several forestry practices are not similar to ownership type and change over time.
Several researchers identified the cost trends for forestry practices in the southern U.S. (Moak 1982; Dubois 1991; Belli 1993; Maggard and Barlow 2018; Callaghan et al. 2019; Maggard 2021). The first study of cost trend analysis from 1959 to 1982 found that forestry costs increased significantly more than the price of lumber (Moak 1982). However, in the U.S. South, the real cost of major forestry practices on private lands remained relatively constant between 1982 and 2002, with a few exceptions (Bair and Alig 2006). The costs again increased until 2008, when fuel prices were at an all-timber high, and followed a sharp decline after 2012, when fuel prices began to decline (Callaghan et al. 2019). Maggard and Barlow (2018) reported that the majority of costs decreased from 2012 to 2016, with an exception for chemical applications and hand plating. It shows that the forestry practices’ costs highly depend upon fuel prices and labor costs. However, fuel-efficient machinery used in forestry practices could give some resiliency against both labor costs and fuel prices (Callaghan et al. 2019).
These aforementioned costs are aggregated and averaged at the regional level. Only a few cost studies have been carried out at the state level in the southern states, such as Mississippi (Arano et al. 2002; Arano and Munn 2006; Chhetri 2019) and Georgia (Chhetri 2022). Arano and Munn (2006) compared the expenditures between IFLs and FFOs and found that IFLs had higher spending on silviculture activities than FFOs. The study further demonstrated that site preparation costs accounted for approximately half of the total forestry activities (Arano and Munn 2006, Chhetri et al. 2019). In Georgia, chemical treatment accompanied by burning was commonly used as a cost-effective technique for site preparation (Chhetri et al. 2022). The cost associated with forestry activities influences by fuel prices, labor supply, forest product demand, and policies (Callaghan et al. 2019). These influencing factors vary across the states and change over time. So using aggregated and averaged information could be misleading. Therefore, it is essential to have updated information at the state level that provides a finer resolution of data for timberland appraisal, timber financial return analysis, and timber supply analysis.
This study attempts to fill the gap by comparing the forest management objectives between FFOs and IFLs and the costs associated with forestry practices through a survey of consulting foresters working in Arkansas. Consulting foresters are the most common way FFOs obtain forestry support, and consultants in Arkansas also provide these services for many IFLs. This study provides more robust information on Arkansas forest management practices and costs. The findings can be helpful to landowners, consulting foresters, policymakers, timber investment analysts, and timber supply modellers. Landowners can use this information to plan their forest management practices. Consulting foresters can benefit from expanding their knowledge and geographical scope based on the services requested by landowners. Policymakers can formulate programs to encourage and motivate landowners to invest in forestry practices. Timber investment analysts can use the information while making a forest investment decision. Finally, with the robust information, the timber supply modellers can better estimate the future forest product availability in the regions.
METHODS
Survey and data
Qualtrics (2022), an online survey tool, was the primary source of data collection. The database of consulting foresters’ contact information was acquired from the Arkansas Board of Registration for Foresters. The survey was pre-tested with a few consulting foresters using a mail survey. During the pre-test, participants were asked if the questions were clear and understandable. Prior to implementation, the survey was reviewed and approved by the Institutional Review Board (IRB approval number 2022: FANR 1003) of the University of Arkansas at Monticello. The survey was emailed to 318 consulting foresters working across Arkansas. The online surveys were sent on July 20, August 22, and September 7, 2022. In the email, respondents were assured of their information confidentiality, voluntary participation, and right to withdraw their participation. Also, on the first page of the survey, respondents were asked for the consent of the participants.
The survey instrument broadly consists of four parts. Part I of the survey solicited respondents’ years of practice, most frequently worked counties, and most timber-producing counties for the next five-ten years. Most questions in Part I are closed-ended. Part II sought information related to their clients, which includes clients’ forest management objectives, common services requested by landowners, and landowners’ willingness to sell forest products. Part III provides information about the cost associated with several forestry activities such as site preparation, planting, thinning, and timber cruising and inventory. The respondents were asked to fill in the dollar per acre for each activity for hardwood and pine separately. Later, the dollar per acre was converted into a dollar per ha while presenting the results. Part IV asks for the respondent’s demographic characteristics, including age, gender, race, household income, and highest education level.
In addition, we have collected the county-level growing stock, annual net growth, and annual surplus of forestland from the Forest Investment and Analysis (FIA) database to validate the respondents’ information about timber production in counties.
Nonresponse Bias
A nonresponse bias test was conducted to detect a potential difference between recorded survey information and non-respondents who did not answer our survey. A Mann-Whitney U-test was used to test the differences in respondents’ opinions on the level of requisition for major forestry practices between the late and early respondents. Except for hand planting (p=0.02), there were no significant differences in the opinions about other major forestry practices between these two groups (p=0.23 for mechanical site preparation, p=0.22 for chemical site preparation, p=0.49 for machine planting, and p=0.31 for prescribed burning). With this, the authors feel that there is no substantial concern of nonresponse bias in this study.
Data Tools
The study integrated the Forest Investment and Analysis (FIA) dataset into ArcMap (10.8.1) software to explore and analyze the potential counties for timber availability. The FIA program of the USDA Forest Service collects, analyses, and reports information about the status and trends of the U.S. forestlands. FIA has a number of tools available to analyze the required information. We used the DATIM tool and selected attributes of “net merchantable bole volume of growing stock trees (at least 5 inches d.b.h.) on forestland” and “average annual net growth/removal of merchantable bole volume of growing stock (at least 5 inches d.b.h) in forestlands”, which give county-level growing stock, net growth, and removals. We categorized the county-level growing stock into six different categories to explore the timber production potential counties. Also, three-point Likert scales were used to examine the most frequently requested services by the clients to consulting foresters. The reason for using a three-point Likert scale was to reduce the number of responses possible because the answer matrix was extensive, with 18 services. For instance, the matrix would be 18x5 is 90 and 18x3 is 54, so we cut the complexity roughly in half by reducing the Likert Scale. Finally, we have presented the results in the tables and figures.
RESULT AND DISCUSSIONS
Survey response
A total of 83 consulting foresters responded in the online survey, and only 38 responses were usable after removing those with incomplete responses in the questionnaire. Of the 318 surveys sent, 45 surveys were determined ineligible because of failure to deliver email, resulting in a 14% of adjusted response rate (Table 1). A similar response rate was reported in a recent study by Rubino et al. (2022) in Arkansas. Comparing key variables using a t-test indicates no significant differences between respondents and non-respondents: age (p=0.08), working experience (p=0.22), percentage of IFL clients (p=0.32), and percentage of FFO clients (p=0.51).
Table 1. Online survey response rate.
|
Items |
Number |
|
Total survey sent |
318 |
|
Failure delivery |
43 |
|
Net delivery |
275 |
|
Total participation |
83 |
|
Usable response |
38 |
|
Response rate |
30.18% |
|
Usable response rate |
13.82% |
Consulting forester characteristics and their service
The survey results indicate that most of the respondents (84.62%) were over 40 years old. All of the respondents were male. Almost all respondents identify their race as White/Non-Hispanic. Compared with the state’s median household income ($49,475 per annum), most respondents (85.71%) have higher household incomes than the state average. All respondents had at least a bachelor’s degree (Table 2).
Table 2 further presents the characteristics of the surveyed foresters, including their credentials. Many consulting foresters have multiple credentials. The Society of American Foresters, Arkansas Forestry Association, and Association of Consulting Foresters were the primary professional organization for consulting foresters. In Arkansas, foresters are required to be licensed (registered) by the state to perform consulting services to the public. All of the respondents are registered foresters. The study did not include foresters who have not registered on the board and may be practising forestry on land owned by their employers or themselves.
Table 2. Sociodemographic and credentials characteristics of the consulting foresters taking part in the survey, 2022.
|
Sociodemographic characteristics |
Categories |
Count (%) |
|
Age (years) |
Less than 40 |
4 (15.38) |
|
(n=26) |
40-50 |
10 (38.46) |
|
|
51-60 |
3 (11.54) |
|
|
More than 60 |
9(34.62) |
|
Gender |
Male |
26 (100) |
|
(n=26) |
Female |
0 (0) |
|
Race |
White/Non-Hispanic |
25 (96.15) |
|
(n=26) |
Hispanic |
0 (0) |
|
|
Black |
0 (0) |
|
|
American Indian |
0 (0) |
|
|
Others |
0 (0) |
|
|
Prefer not to answer |
1 (3.85) |
|
Income |
Less than $49,475 |
3 (14.29) |
|
(n=21) |
More than $49,475 |
18 (85.71) |
|
Education |
Less than Bachelor |
0 (0) |
|
(n=26) |
Bachelor |
23 (88.46) |
|
|
Master |
3 (11.54) |
|
Credentials |
Professional membership |
|
|
(n=38) |
Society of American Foresters |
14 (36.84) |
|
|
Association of Consulting Foresters |
11 (28.95) |
|
|
Arkansas Forestry Association |
25 (65.79) |
|
|
License Appraiser |
7 (18.42) |
|
|
Certified Prescribed Burner |
4(10.53) |
|
|
Real Estate License Holder |
9 (23.68) |
|
|
|
|
The results show that consulting foresters’ work was concentrated on lands in the southern part of Arkansas (Figure 1).
Many respondents were working in Calhoun, Union, Bradley, Ouachita Dallas, Grant, Cleveland, Jefferson, Drew, and Ashley counties for providing services to landowners. Except for Jefferson, all other nine counties have a growth-to-drain ratio greater than one (Table 3). However, it should be noted that the standard error (SE) per cent values for individual counties are quite large, ranging from 21% to 36%. However, data for the 10-county region has a SE% of less than 9%. This suggests that the timber removal rate was lower than the net annual growth, which implies that Arkansas’ timber availability is increasing every year.
Our study did not get any response from consulting foresters working in the state’s Northeast region or Mississippi Alluvial Plain. One possible reason might be that the region has a lower forest cover percentage than the south-central part of Arkansas. This corresponds with previous results (Chhetri et al. 2018) showing that consultants focus their attention on properties with high wood volume. Landowners may also consider unacceptable the economic tradeoffs of hiring a consultant in small parcel sizes and low-productive timber stands (Birch 1997).
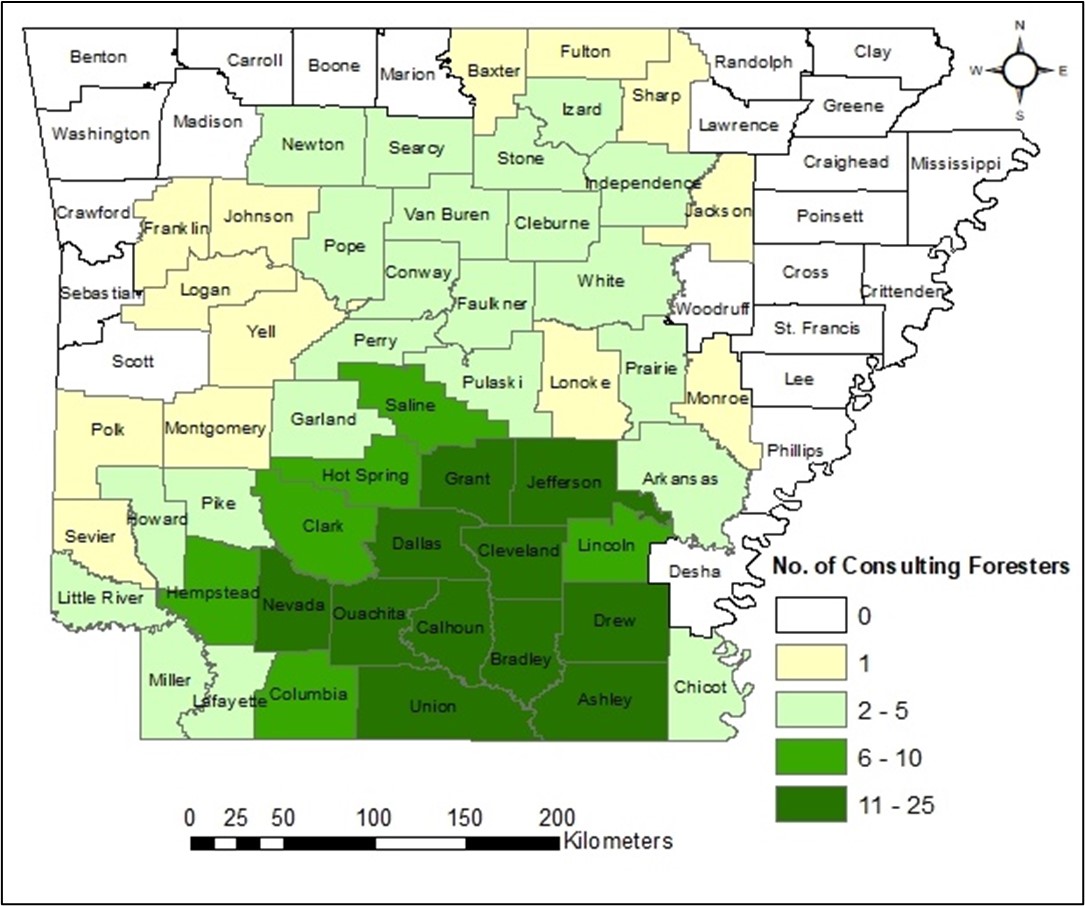
Figure 1. The respondents’ most frequent working counties during the last five years are based on an online survey of consulting foresters in Arkansas in 2022.
Table 3. Current physical and biological timber supply conditions of the consulting foresters most frequently working counties.
|
County |
Net annual growth (in metric tons) |
Removal (in metric tons) |
Growth-to-drain ratio |
|
Calhoun |
1,394,271 |
959,153 |
1.45 |
|
Union |
1,591,854 |
943,255 |
1.69 |
|
Bradley |
1,166,084 |
1,040,309 |
1.12 |
|
Ouachita |
1,321,074 |
749,536 |
1.76 |
|
Dallas |
1,586,597 |
625,968 |
2.53 |
|
Grant |
1,674,397 |
1,168,440 |
1.43 |
|
Cleveland |
1,247,172 |
908,744 |
1.37 |
|
Jefferson |
443,797 |
699,151 |
0.63 |
|
Drew |
1,787,137 |
1,745,428 |
1.02 |
|
Ashley |
1,966,444 |
810,402 |
2.43 |
The survey revealed that consultants in Arkansas consider the 27 counties shown in figure 2A to have the most potential for timber production in the next 5-10 years. Among them, the leaders are the four counties, Bradley, Calhoun, Cleveland, and Dallas. FIA data sets show that those counties (Columbia: 28.1 million metric tons, Dallas: 24.3 million metric tons, Calhoun: 24.2 million metric tons, and Cleveland: 20.9 million metric tons) have the most total timber growing stock after Scott and Yell counties, but the growing stock of Scott and Yell counties is largely public forest, Ouachita National Forest (in Scott county) and Ozark National Forest (in Yell county) (Figure 2B). Furthermore, the study found most of the forest industries were distributed in southern Arkansas, where the growing stock of softwood sawtimber and pulpwood were concentrated (Figure 2C and 2D).
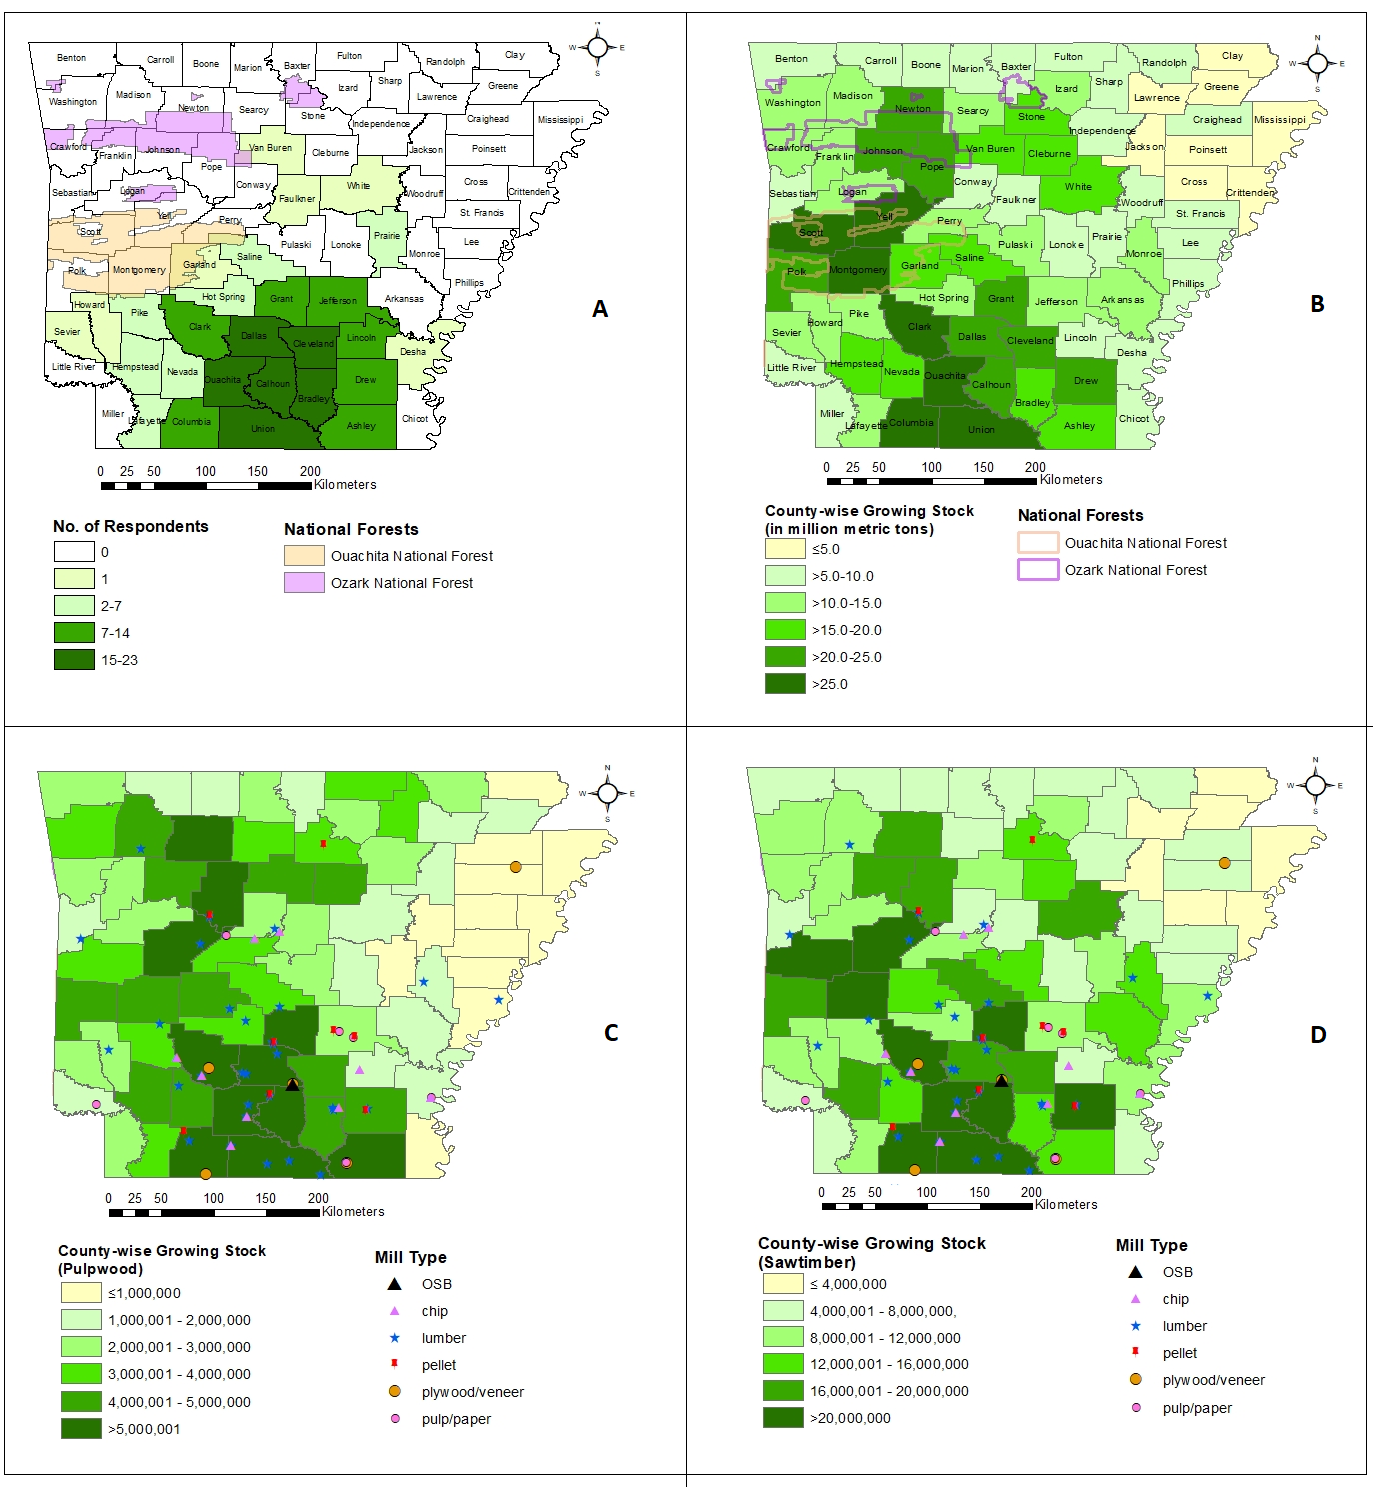
Figure 2. The figures above show the county-wise forest growing stock and distribution of forest industries in Arkansas. Fig A: the most potential counties for timber production in the next 5-10 years, based on an online survey of consulting foresters in Arkansas, 2022; Fig B: County-wise total growing stock; Fig C: County-wise pulpwood stock and distribution of forest industries; and Fig D: County-wise sawtimber stock and distribution of forest industries in Arkansas using FIA database in 2021, Arkansas.
The Arkansas Center of Forest Business (2021) reported that within a one-county radius around Lafayette, Union, Ouachita, Chicot, and Columbia, annual net growth exceeds harvest by more than four million tons for each county. All of these counties are situated in southern Arkansas. Since more than 93% of these counties’ forestlands are owned by private forest landowners, the South Arkansas region is crucial in supplying wood fiber to the forest industries.
Comparison of forest management objectives between FFOs and IFLs
Table 4 shows that consultants reported that about 89% of the FFOs and 93% of the IFLs were interested in selling sawtimber. No significant differences in landowners’ interest in selling sawtimber were found between the two ownership types (p=0.12). However, landowners’ interest in selling pulpwood (p<0.01) and chip and saw (p<0.02) found significant differences between the two ownership types. On average, 69% of the FFOs were interested in selling chip and saw, and 81% in pulpwood. Whereas 86% and 94% of the IFLs reported by consultants were interested in selling chip and saw, and pulpwood, respectively. These results suggest that landowners who requested assistance from consulting foresters were interested in producing different product types. This result is also supported by figure 3, where timber production (weighted score for FFOs and IFLs are 11.15 and 11.24, respectively) was the topmost objective of both landowners. Forest management for pine straw production was the least stated objective for FFOs (1.0) and IFLs (1.59). Similarly, previous studies also found that FFOs often have an interest in the joint production of timber and other amenities values (Egan 1997; Kline et al. 2000; Conway et al. 2003).
Private landowners who choose to work with consultants can be characterized as profit maximizers who prefer amenities such as aesthetics, biodiversity, air quality improvement, and higher property values (Newman and Wear 1993). Although Arkansas has plenty of loblolly and shortleaf pine trees, the study shows landowners’ objective to harvest pine straw was the least important. According to the Mississippi State University Extension (2022), landowners can make $371 per hectare by collecting fallen needles. Similarly, in Georgia, landowners could receive about $408 per hectare from the sale of longleaf pine straw (Chhetri et al. 2022). Longleaf and slash pines are preferred for pine straw over loblolly and shortleaf, but loblolly is also used for pine straw production. It is possible to generate income from timber production coupled with nontimber forest products (e.g., selling pine straw and hunting leases) that could increase the profitability for FFOs.
Table 4. Landowners’ interest, as reported by consulting foresters, in selling sawtimber, chip and saw, and pulpwood in Arkansas, 2022.
|
Timber Class |
Ownership Type |
p-value |
|
|
|
FFO (%) |
IFL (%) |
|
|
Sawtimber |
89 |
93 |
0.12 |
|
Chip and Saw |
69 |
86 |
0.02 * |
|
Pulpwood |
81 |
94 |
0.01 * |
Note: *Significant at the 0.05 level.
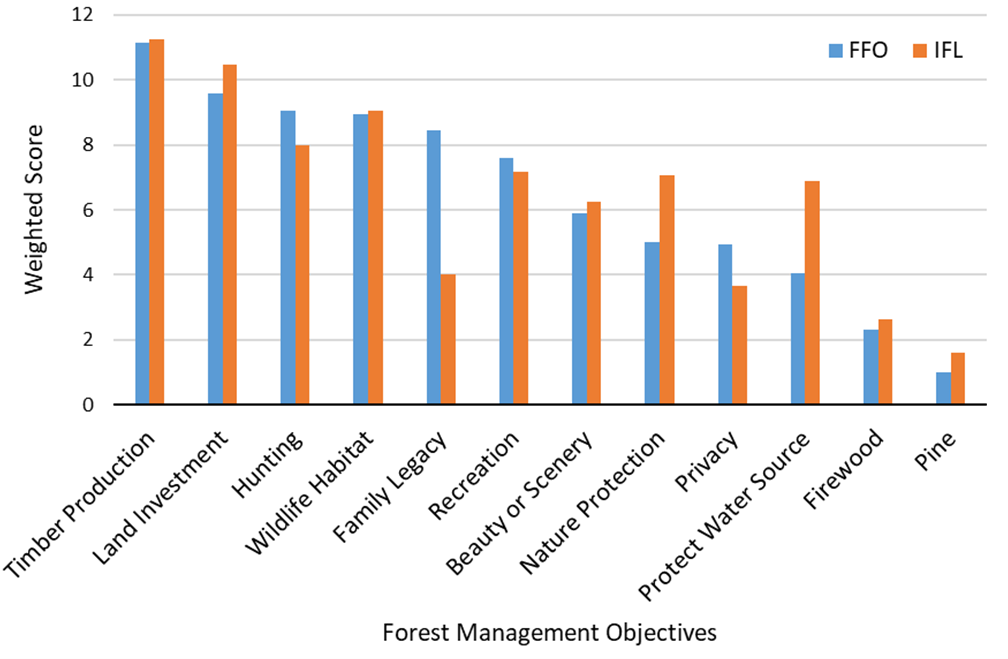
Figure 3. Forest management objectives of FFO and IFL based on an online survey of consulting foresters in Arkansas, 2022.
Comparison of forestry services requested by FFOs and IFLs
Consulting foresters were asked to rank forestry services requested by both landowner groups on a three-point Likert scale (1= never or rarely, 2= occasionally, and 3= frequently). Based on a survey, FFOs most frequently requested six of 18 major forestry services provided by consulting foresters. The results revealed that the six most requested services by FFOs included forest product sales (83%), thinning (83%), timber cruising (73%), hand planting (65%), chemical site preparation (62%), and timber inventory (60%) and (Table 5). They requested a few tax-related services (5.88%) and never or rarely requested services for pruning and fertilization.
In contrast, the results showed that many IFLs never or rarely requested these services from consulting foresters. One of the possible reasons is that industrial or corporate forest landowners employ foresters themselves. However, a few IFL respondents reported requesting services for timber cruising (46%), thinning (48%), and forest product sales (40%). Thinning usually involves a timber sale, so these answers may be highly correlated.
Table 5. Forestry services requested by forest landowners based on an online survey to consulting foresters in Arkansas, 2022.
|
Forestry services |
|
Level of requisition by FFO (%) |
|
|
Level of requisition by IFL (%) |
|
||||
|
N |
Never or rarely |
Occasionally |
Frequently |
Median ranking |
N |
Never or rarely |
Occasionally |
Frequently |
Median ranking |
|
|
Mechanical site preparation |
31 |
29 |
45 |
26 |
2 |
27 |
63 |
19 |
18 |
1 |
|
Chemical site preparation |
31 |
19 |
19 |
62 |
3 |
27 |
63 |
7 |
30 |
1 |
|
Burning for site preparation |
31 |
26 |
45 |
29 |
2 |
27 |
59 |
26 |
15 |
1 |
|
Bedding |
30 |
53 |
37 |
10 |
1 |
27 |
70 |
15 |
15 |
1 |
|
Hand planting |
31 |
13 |
23 |
65 |
3 |
27 |
63 |
0 |
37 |
1 |
|
Machine planting |
31 |
26 |
45 |
29 |
2 |
27 |
63 |
15 |
22 |
1 |
|
Prescribed burning |
31 |
19 |
55 |
26 |
2 |
27 |
59 |
33 |
8 |
1 |
|
Pruning |
28 |
96 |
4 |
0 |
1 |
27 |
96 |
4 |
0 |
1 |
|
Thinning |
29 |
3 |
14 |
83 |
3 |
27 |
41 |
11 |
48 |
2 |
|
Mid rotation release |
28 |
46 |
43 |
11 |
2 |
27 |
70 |
15 |
15 |
1 |
|
Herbaceous weed control |
29 |
41 |
35 |
24 |
2 |
27 |
63 |
4 |
33 |
1 |
|
Fertilization |
29 |
90 |
10 |
0 |
1 |
27 |
96 |
4 |
0 |
1 |
|
Timber cruising |
30 |
0 |
27 |
73 |
3 |
28 |
25 |
29 |
46 |
2 |
|
Timber inventory |
30 |
3 |
37 |
60 |
3 |
28 |
25 |
32 |
43 |
2 |
|
Forest product sale |
30 |
0 |
17 |
83 |
3 |
27 |
41 |
19 |
40 |
2 |
|
Recreational land management |
29 |
14 |
55 |
31 |
2 |
27 |
63 |
18 |
19 |
1 |
|
Timberland appraisal |
28 |
22 |
39 |
39 |
2 |
28 |
54 |
29 |
17 |
1 |
|
Tax services |
29 |
52 |
34 |
14 |
1 |
27 |
81 |
0 |
19 |
1 |
Costs associated with common forest management activities
Consulting foresters were asked to estimate the unit cost of several services related to owning and managing pine and hardwood forestland. Except for the cost of preparing a written forest management plan, all other services are estimated on a per-ha basis. Since the mean value is sensitive to outliers, Table 6 reported the median value as well, which reduces the impact of outliers.
Site preparation
The two most common techniques for site preparation in Arkansas were chemical site preparation and prescribed burning. The median chemical site preparation cost (pine: $216 per ha; hardwood: $247 per ha) was higher than prescribed burning ($124 per ha for pine and $136 per ha for hardwood). The chemical site preparation cost was similar to the regional average ($215 per ha) reported by Maggard (2021), and it was slightly higher than Georgia ($210 per ha) reported by Chhetri et al. (2022). In contrast, the cost for prescribed burning for site preparation was higher ($124 per ha for pine and $136 per ha for hardwood) than the regional average ($86 per ha) (Maggard 2021).
Planting
Mainly there are two types of planting methods: 1) hand planting; and 2) machine planting of seedlings. The cost associated with planting includes the seedling and the labor cost to plan them. The cost of hand planting ($138 per ha) was lower than the machine planting ($259 per ha) in pine and equal in hardwood (hand planting and machine planting: $371 per ha). Hand planting cost in Arkansas was lower than in other southern states (Georgia: $161 per ha; Mississippi: $248 per ha; and averaged regional cost ranged from $129 to $220 per ha) (Maggard and Barlow 2018; Chhetri 2022). These costs could also vary by planting land and type of seedling used.
For instance, bareroot slash pine planting costs $126 per ha, and container pine seedlings in cutover land could cost $179 per ha (Maggard and Barlow 2018). Containerized seedlings, controlled pollinated seedlings, and varietals (clones) are growing in popularity in the South for extending the planting season and superior growth characteristics, but in Arkansas, the production of containerized seedlings is an order of magnitude less than of bare-root seedlings. Seedlings of these types, however, are often planted at lower densities resulting in similar overall planting costs.
Timber management activities
Prescribed burning in mid-rotation release, thinning, mid-rotation fertilization, and pruning were some common timber management activities carried out to reduce vegetation competition, prevent future wildfire damage, and promote the growth and development of the tree stands. Prescribed burning in mid-rotation release cost was lower ($86 per ha) for pine than hardwood ($105 per ha). The respondents reported the cost of thinning ($148 per ha), mid-rotation chemical release ($148 per ha), and pruning ($62 per ha) to pine forests. The result revealed that the cost of prescribed burning in the study area was about twice the cost reported in Mississippi and Georgia. The difference between costs reflects a difference in blends of burning conditions, site characteristics, and forest types. For instance, bush, range, and grassland burns were less costly than tree stands (Cleaves et al. 1999).
Timber stand improvement
The results found that timber stand improvement activities, such as timber inventory and timberland appraisal for both forest types, were similar. For both forest types, timber inventory and timberland appraisal costs were $21 per ha and $22 per ha, respectively. Surprisingly, the timber cruising and marking costs were higher for pine ($52 per ha) than hardwood ($45 per ha). In general, timber marking for hardwood almost always takes more time, ultimately increasing the cost. However, the diameter limit method for hardwood marking is inexpensive. The survey used to carry out this study did not gather information about the marking methods. The timber marking cost for the pine in this study was similar ($32 per ha) as reported by Maggard (2021).
Table 6. Estimated unit cost for common forestry practices by species types as reported by consulting foresters in Arkansas, 2022.
|
Forestry activities |
Pine ($/ha) |
Hardwood ($/ha) |
|
||
|
|
Median |
Mean |
Median |
Mean |
Average Southeastern U.S. ($) |
|
Site preparation techniques |
|||||
|
Mechanical site prep |
618 |
563 |
494 |
494 |
395 |
|
Chemical site prep |
210 |
215 |
247 |
247 |
213 |
|
Prescribed burning for site prep |
124 |
127 |
136 |
136 |
86 |
|
Chemical site prep with burning |
334 |
331 |
352 |
352 |
* |
|
Fertilization associated with planting |
216 |
216 |
210 |
210 |
217 |
|
Planting methods |
|||||
|
Hand planting |
138 |
185 |
371 |
313 |
195 (P), |
|
Machine planting |
259 |
245 |
371 |
329 |
232 (P) |
|
Timber management activities |
|||||
|
Thinning |
148 |
148 |
* |
* |
356 |
|
Prescribed burning in mid-rotation release |
86 |
97 |
105 |
105 |
77 |
|
Mid-rotation chemical release |
148 |
146 |
* |
* |
217 |
|
Pruning |
62 |
62 |
* |
* |
* |
|
Timber stand improvement |
|||||
|
Timber cruising and marking for a sale |
52 |
54 |
25 |
45 |
32 |
|
Timber inventory |
21 |
30 |
21 |
30 |
* |
|
Timberland appraisal |
22 |
31 |
22 |
27 |
* |
Note: *No response, (P) - pine.
Written management plan
Obtaining a forest management plan is often the first step for forest landowners to get assistance from consulting foresters (Zhang et al. 1998), and it could be quite costly. In the study area, consulting foresters charge a fee for the preparation of written management plans on two bases: 1) flat rate basis; and 2) per-ha basis. The flat rate fee for preparing a management plan had a mean of $1,730 and ranged from $741 to $3,707 (Table 7). This flat rate is applicable when the forest size is within a specified cut-off size. The provision of the cut-off size of forestland varies with consulting foresters. The study found that the cut-off size lies between 99 to 494 hectares. After each additional size increase in cut-off size, consulting forester charges $10 per ha for the preparation of the management plan. The survey found that consulting foresters charged on a per-hectare basis as well. On average, $29 per ha has been charged for the preparation of the forest management plan which was similar to those from Georgia (Chhetri et al. 2022) and earlier study in Mississippi if inflation is adjusted for (Wright and Munn 2016). However, respondents mentioned that this rate depends upon two main factors, the distance between the location of the forest and the consultant and the total time taken to collect data and write the plan.
Table 7. Consulting foresters reported the estimated cost for a written forest management plan in Arkansas in 2022.
|
Forest management plan |
Cost of a management plan |
Cut off size (ha) |
Additional ($/ha) |
|||
|
|
Median |
Minimum |
Maximum |
Minimum |
Maximum |
Median |
|
Flat rate |
$1,730 |
$741 |
$3,707 |
99 |
494 |
$10 |
|
Per-hectare basis |
$29 |
$15 |
$49 |
|
|
|
The results show that site preparation had the highest cost among the major forestry activities. This cost depends upon the activity that includes practices such as shear-rake-pile-beds, subsoiling, and drum chopping. In addition, the number of passes also determines the average cost of mechanical site preparation. The study found that the cost of single-pass operations was 34% less than double-pass operations (Maggard 2021). However, even the single-pass operations of mechanical site preparation costs were higher than the chemical site preparation cost. Due to recently increased machinery and fuel costs for mechanical site preparation and the effectiveness of the chemical compound in reducing the undesired species, the chemical site preparation method is more common in Arkansas.
The increases in machinery and fuel cost have also affected planting costs. These costs could vary by forest tract size. As forest tract size decreases, the cost per ha of treatment increases. The Alabama Cooperative Extension Services (2018) stated that “a good rule of thumb is treating larger areas generally costs slightly less per acre basis than the same treatment on smaller acreages.” Moreover, the choice of species could affect the cost. Hardwood plantation costs tend to be more expensive for seedling and planting costs, while other establishment costs remain the same (Tanger and Blazier 2019). Our study further attempted to observe the cost difference in timber management activities (i.e., thinning, prescribed burning in mid-rotation release, mid-rotation chemical release, and pruning) among pine and hardwoods, but the study was unable to compare the costs due to a lack of response. One of the possible reasons for the low response is that timber management activities were not common in hardwoods.
The study findings were described based on the perspectives of consulting foresters. A single consulting forester can work in different counties having different site conditions and geographical locations.Thus, the management practices and costs associated with them might vary, and the respondents reported an aggregated value that might limit the applicability of the findings to other regions of Arkansas. However, this study provides reasonable state-level estimated costs and management intensities in the primary timber production regions that help landowners, forest industries, timber investment analysts, and policymakers assess the forest sustainably.
CONCLUSIONS
The study provides thorough information on current forest management conditions and costs in Arkansas, USA. Results found that southern Arkansas has substantial potential for additional timber supply in the market. The presence of a large quantity of timber growing stock and annual surplus growth could sustain forest industries in this region. Specifically, Columbia, Dallas, Calhoun, and Cleveland counties have excess timber growing stock, and Lafayette, Union, Ouachita, Chicot, and Columbia counties have annual surplus growth. This surplus timber can be better utilized to meet the demand of the market, which ultimately contributes to increase the regional and national economy and forest health.
Most importantly, unlike the previous studies, this study shows no significant difference in ownership objectives between FFOs and IFLs, based on the sample of those owners who received consulting forestry assistance. Literature indicates that FFOs usually focus on nontimber management goals and do not typically own forestland primarily to produce timber. However, consulting foresters could be more frequently used by or help motivate FFOs to have an interest in timber production and income. And since consultants are typically paid a percentage of timber receipts, there is an incentive for consultants to recommend timber harvests as a way to reach many FFL objectives. The questions remain to be studied; is there a correlation between timber harvesting and the use of consulting foresters, but which variable is the independent variable?
The FFOs requested several forest management services from the consulting foresters. The most requested services by family landowners included chemical site preparation, planting, thinning, timber inventory, and timber cruising. However, these services were less requested by IFLs. IFLs may contract directly with service organizations for these activities and do not need a consulting forester to make recommendations and serve as an intermediary in the transaction.
The study estimated robust state-level costs for the most common forestry activities. The costs could provide an input variable for estimating financial returns from timberland investment, modelling timber supply availability in the future, and serve as a benchmark to investigate the trends in forest management intensity and costs across the state. Regular studies about forest management practices and the costs associated with them are needed to reflect changes in practices and their costs.
ACKNOWLEDGMENTS
The authors are grateful to the Arkansas Center for Forest Business, College of Forestry, Agriculture & Natural Resources, University of Arkansas at Monticello, for providing financial support to conduct this study. In addition, the authors would like to express sincere thanks to all Arkansas consulting foresters who provided their valuable time to respond to the survey.
CONFLICT OF INTERESTS
The authors declare no conflict of interest.
REFERENCES CITED
Adhikari RK, Grala RK, Grado SC, Grebner DL, Petrolia DR. 2021. Landowner concerns related to availability of ecosystem services and environmental issues in the southern United States. Ecosystem Services, 49,101283. doi:10.1016/j.ecoser.2021.101283
Alabama Cooperative Extension System. 2018. Cost for common forestry practices in the South. 2018. Available online: www.aces.edu/natural-resources/forestry/economics-management/forestrypractice.php (accessed on 10/21/2018)
Arkansas Department of Agriculture. 2022. Arkansas’s forest facts. Available from: https://www.agriculture.arkansas.gov/wp-content/uploads/2022/05/2021-Forest-Facts-of-AR-1.pdf (accessed on 11/30/22)
Arano KG, Cushing TL, Munn IA. 2002. Forest management expenses of Mississippi’s nonindustrial private forest landowners. Southern Journal of Applied Forestry, 26(2), 93-98. doi.org/10.1093/sjaf/26.2.93
Arano KG, Munn IA. 2006. Evaluating forest management intensity: a comparison among major forest landowner types. Forest Policy and Economics, 9(3), 237-248. doi.org/10.1016/j.forpol.2005.07.011
Arkansas Center for Forest Business. 2021. County forests and forest industry, 2021. Arkansas Center for Forest Business, University of Arkansas at Monticello. Report 20021-C1-75. Monticello, AR.
Bair LS, Alig RJ. 2006. Regional cost information for private timberland conversion and management. USDA Forest Sercice Gen. Tech. Rep. PNW-GTR-684. Pacific Northwest Research Station, Portland, OR. 26p.
Belli ML, Straka TJ, Dubois M, Watson WF. 1993. Costs and cost trends for forestry practices in the South. For. Farmer, 52(3), 25-31.
Birch TW. 1997. Private forestland owners of the southern United States, 1994. USDA Forest Service, Research Bulletin, Northeastern Forest Experiment Station-138. 195 p. doi: 10.2737/NE-RB-137.
Callaghan DW, Khanal PN, Straka TJ. 2019. An analysis of costs and cost trends for southern forestry practices. J For. 117: 21–29. doi:10.1093/jofore/fvy060.
Chhetri SG, Gordon JS, Munn IA, Henderson JE. 2018. Factors influencing the use of consulting foresters by non-industrial private forest landowners in Mississippi. The Forestry Chronicle, 94(3), 254-259. doi.org/10.5558/tfc2018-038.
Chhetri SG, Parker J, Izlar RL, Li Y. 2022. Forest management practices and costs for family forest landowners in Georgia, USA. Forests, 13(5): 665. doi:10.3390/f13050665.
Chhetri SG, Gordon J, Munn I, Henderson J. 2019. Comparison of the timber management expenses of nonindustrial private forest landowners in Mississippi, United States: Results from 1995–1997 and 2015. Environments, 6(9):107. doi:10.3390/environments6090107.
Cleaves DA, Haines TK, Martinez J. 1999. Prescribed burning costs: trends and influences in the National Forest System. In Proc. of the Symposium on fire economics, planning, and policy: Bottom lines (pp. 277-287). USDA For. Serv., Gen. Tech. Rep. PSW-GTR-173, Pacific Southwest Research Station, Albany, CA.
Conway C, Amacher G, Sullivan J. 2003. Decisions forest landowners make: an empirical examination. J.For.Econ. 9: 81–203. doi:10.1078/1104-6899-00034.
Conrad IV JL, Bolding MC, Smith RL, Aust, WM. 2011. Wood-energy market impact on competition, procurement practices, and profitability of landowners and forest products industry in the U.S. South. Biomass and Bioenergy, 35(1), 280-287. doi.org/10.1016/j.biombioe.2010.08.038.
Dubois MR, Straka TJ, Watson WF. 1991. A cost index for southern forest practices. Southern Journal of Applied Forestry, 15(3), 128-133. doi.org/10.1093/sjaf/15.3.128
Egan, A.F. 1997. From timber to forests and people: a view of nonindustrial private forest research. North J Appl For. 14: 189–193. doi:10.1093/njaf/14.4.189.
Kline J, Alig R, Johnson R. 2000. Fostering the production of nontimber services among forest owners with heterogeneous objectives. For Sci. 46: 302–311. doi:10.1093/forestscience/46.2.302
Kluender RA, Walkingstick TL. 2000. Rethinking how nonindustrial landowners view their lands. South J App For, 24(3):150-158. doi:10.1093/sjaf/24.3.150.
Maggard A. 2021. Costs & trends of southern forestry practices 2020. Forestry and Wildlife, Extension Alabama A & M & Auburn Universities. FOR-2115. Auburn AL. 6 p.
Maggard A, Barlow R. 2018. Special report: 2016 costs and trends for southern forestry practices. Forest Landowner. Carrollton, GA, pp. 31–39
Mississippi State University Extension. 2022. Pine straw mulch production. Available from http://extension.msstate.edu/forestry/forest-management/pine-straw-mulch-production. (accessed on 11/14/2022)
Moak JE. 1982. Forest practices cost trends in the South. Southern Journal of Applied Forestry, 6(3), 130-132. doi.org/10.1093/sjaf/6.3.130
Newman DH, Wear DN. 1993. Production economics of private forestry: a comparison of industrial and nonindustrial forest owners. American Journal of Agricultural Economics, 75(3), 674-684. doi.org/10.2307/1243574.
Pelkki M, Sherman G. 2020. Forestry’s economic contribution in the United States, 2016. Forest Products Journal, 70(1), 28-38. doi:10.13073/FPJ-D-19-00037.
Rubino EC, Tian N, Pelkki, MH. 2022. Improving communications to increase nonindustrial private forest landowner (NIPF) participation in forest certification programs: a case study in Arkansas, USA. Forests, 13(1): 86. doi:10.3390/f13010086.
Tanger, SM, Blazier, M. 2019. Management and economic considerations for mixed pine-hardwood stands. Louisiana State University Agriculture Center. Louisiana Cooperative Extension Service. Pub. 3700. 4p.
Tian N, Pelkki M. 2021. Economic Contributions of Arkansas forest industries in 2021. Arkansas Center for Forest Business, University of Arkansas at Monticello, Fact Sheet F2021-1. Available from: https://www.uamont.edu/academics/CFANR/forestbusiness/EconomicContributionsSummary2021.pdf. (accessed 08/18/2022).
USDA Forest Service. 2021. Family forest (10+acres) ownership characteristics: Arkansas, 2018. Res Note NRS-266. Madison, WI. U.S. Department of Agriculture, Forest Service, Northern Research Station. 2 p. doi.org/10.2737/NRS-RN-266.
USDA Forest Service. 2022. State and private forestry fact sheet. Arkansas 2022. Available from: https://apps.fs.usda.gov/nicportal/temppdf/sfs/naweb/AR_std.pdf (accessed on 11/30/2022).
Qualtrics. 2022. Accessed from: https://www.qualtrics.com
Wicker G. 2002. Motivation for private forest landowners. Southern forest resource assessment, 225-237.
Wright WC, Munn IA. 2016. Fees and services of Mississippi’s consulting foresters; Forest and Wildlife Research Center, Mississippi State University: Starkville, MS, USA.
Zhang D, Warren S, Bailey C. 1998. The role of assistance foresters in nonindustrial private forest management: Alabama landowners’ perspectives. Southern Journal of Applied Forestry, 22(2), 101-105. doi.org/10.1093/sjaf/22.2.101.